IdeDebugger |
|
|
Debugger can be termed as a tool to inspect, and change if there is a need, various elements of a running application's virtual-memory at certain defined point(s). Debugger helps to stream-line pitfalls and bottlenecks during development cycle. It lets to inspect all the elements and environment, at certain points of execution set by developer, within which application is running to determine the best course.
Debugger is always seen as an integral part of any kind of application development. Almost all languages implement debugging capabilities either within the language framework or delegating this responsibility to some third party tool. Harbour, the successor of Clipper, implements debugger inside the language itself. Because Harbour implements a console front-end at core, it offers a console-mode debugger interface.
Alexander Kresin separated the user-interface code and retrieval of virtual-memory elements, thus, enabling the path to integrate debugging capabilities to external IDE's. A big thanks to Kresin.
I never dared to bring this capability inside HbIDE due to single reason that I never used Clipper/Harbour debugger at any point of development, and hence, was never confident enough how it can be accomplished. There were many requests to this effect in the past but I never gathered enough motivation to do so. Up came Alex for our rescue and brought Kresin's library to HbIDE. Basics were in-place and working. Thanks Alex for this mammoth effort.
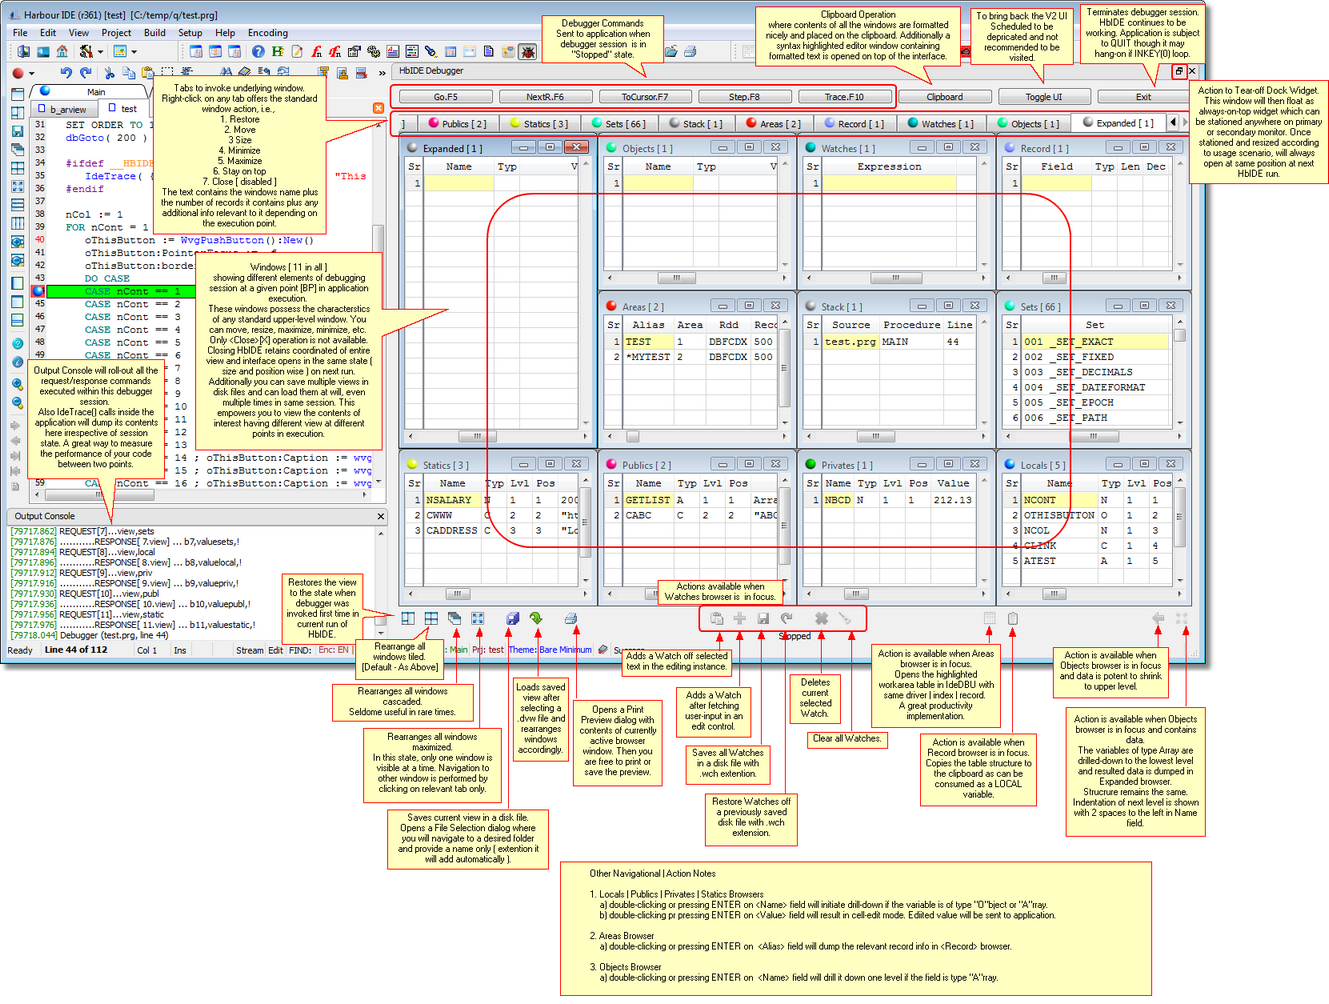
Then remained the task to bring debugging experience to all-together next level, luckily achieved. HbIDE is proud to announce that the next-level of experience can be enjoyed now.
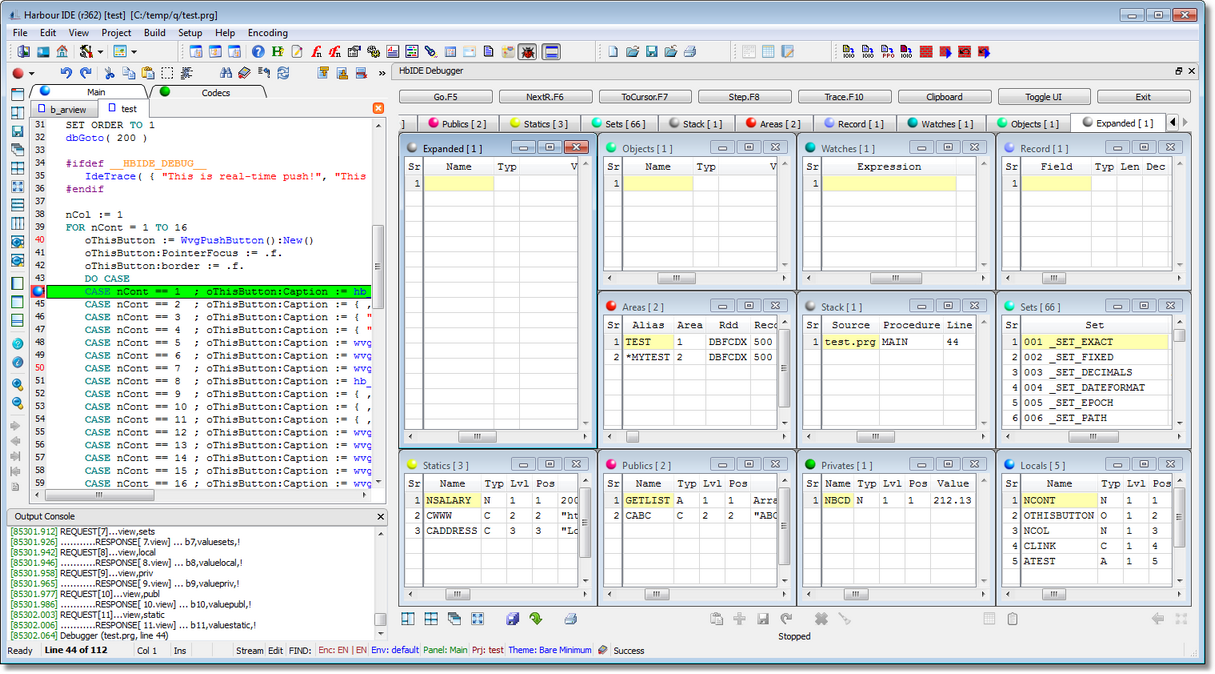
 The first time debugger is invoked after setting a BP.

|
Page url: http://hbide.vouch.info/?idedebugger.htm